

 Standard Deviation & the Measurement of Risk
We’ve understood the importance of Risk v’s Return, now let’s look at how you can measure that risk.
In statistics, standard deviation is used to measure the extent to which numbers are distributed around the average. For investors, it is the usual means by which they can measure the historical volatility of an individual share, fund, or portfolio, by measuring its distance from the average.
The illustration below shows a typical bell curve of the distribution of investment returns. The chart plots the number of occurrences of a monthly return. The average distribution is at the centre of the bell-curve. If the distribution is normal, one standard deviation added or subtracted from the average encompasses about 68% of the occurrences. Two standard deviations would account for 95%.
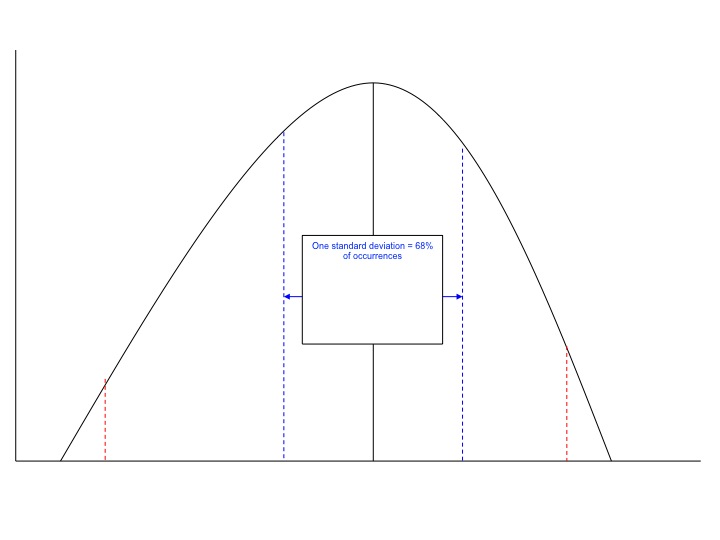 For example, if the average return for a portfolio is 13% and it’s standard deviation is 20%, we would expect returns to fall between -7% and +33%. A standard deviation of 10% would give expected returns in the range +3% to +23%.
The wider the range of returns, the more risk there is in the investment. Clearly, although the deviation can be higher or lower than the average, it tends to be the downside deviation that causes the investor pain and which they need to be aware when selecting a portfolio to match their risk capacity.